
50,000+
Nodes Monitored
15%
Energy Saved
20ms
Latency
99.999%
Uptime
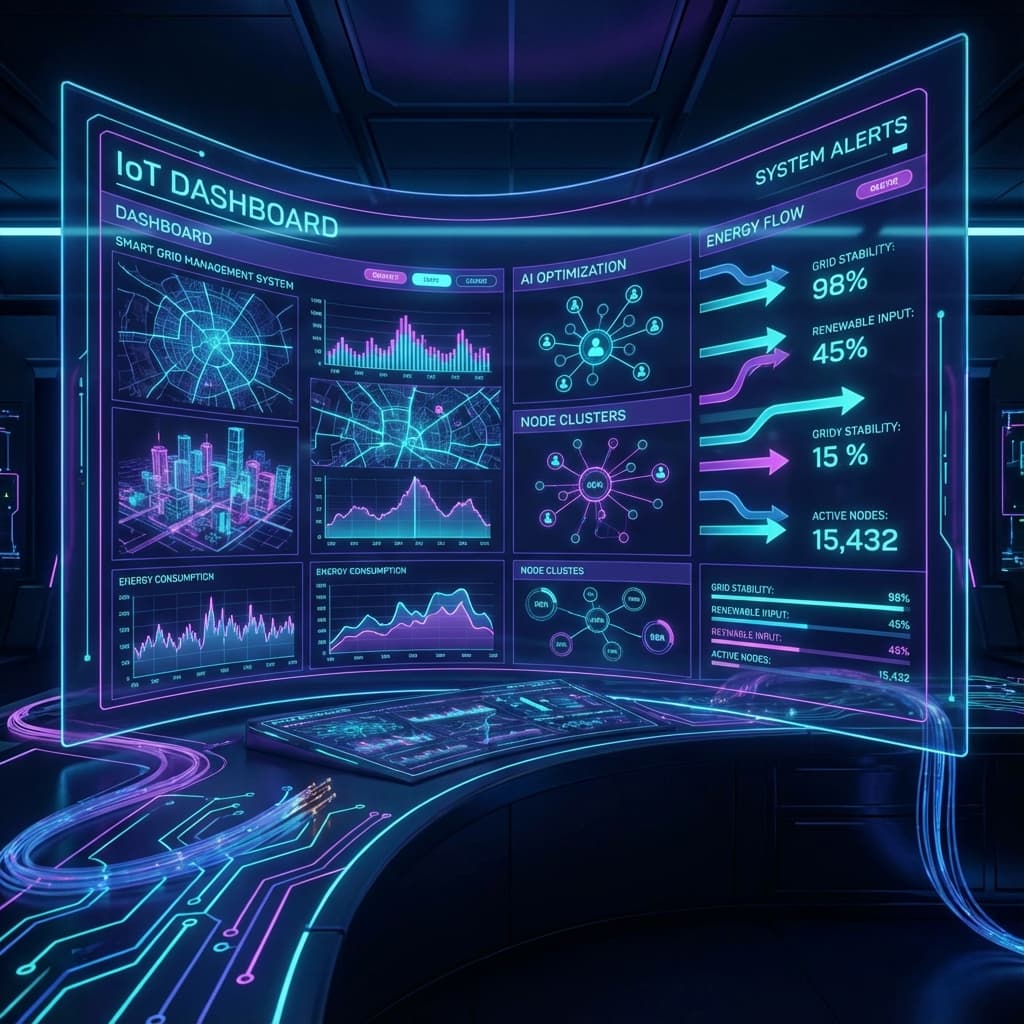
The Challenge
Managing a distributed renewable energy grid requires handling massive streams of telemetry data in real-time. Operators needed a visual interface that could make sense of millions of data points instantly.
Our Solution
Utilized WebSockets for bi-directional real-time communication with field sensors.
Implemented D3.js and WebGL for high-performance data visualization.
Built a predictive maintenance module using machine learning algorithms.
Ensured varied access levels for field technicians and central operators.
Tech Stack
ReactD3.jsRust (Backend)MQTTTimescaleDB
Client Testimonial
"The clarity this dashboard provides allows us to prevent outages before they happen. It's engineering excellence."
O
Ops Manager
Smart Grid Corp